


About
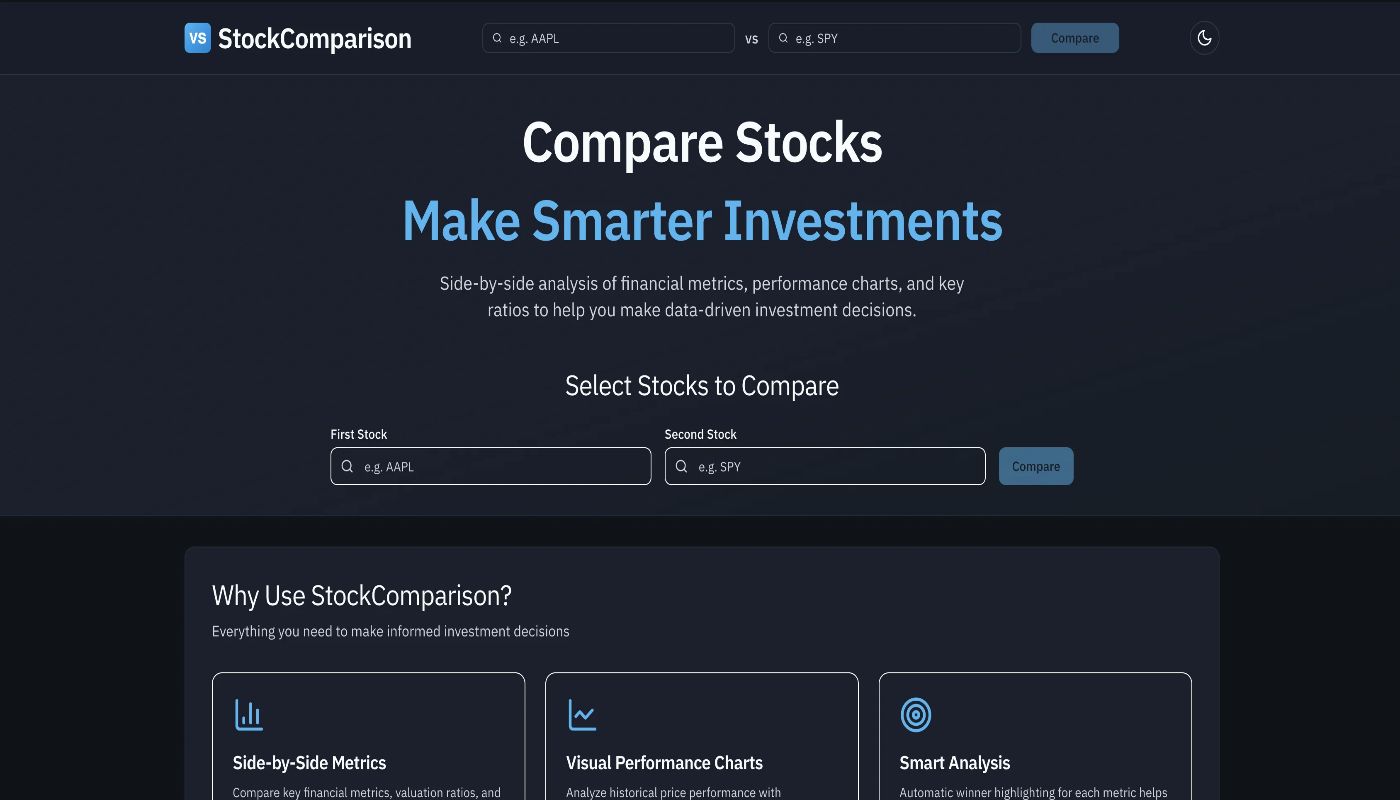
Compare stocks side-by-side with detailed financial metrics, performance charts, and key ratios. Analyze P/E ratios, growth rates, dividends, and more. Make smarter investment decisions with our free stock comparison tool.
Read full description
Compare stocks side-by-side with detailed financial metrics, performance charts, and key ratios. Analyze P/E ratios, growth rates, dividends, and more. Make smarter investment decisions with our free stock comparison tool. Tags: AI Business Data Analysis, Analytics, Business, Charts, Data, Money Target Audience: Retail investors, Beginner traders, DIY investors, ETF investors, and Growth-focused investors. Features: • Side by Side Comparison: Compares stocks directly, showing their differences. • Financial Metrics: Shows key financial data like revenue and profit. • Performance Charts: Displays stock price history visually. • Key Ratios: Calculates and presents ratios like P/E for easy analysis. • PE Ratio Analysis: Lets you see and compare price to earnings ratios. • Growth Rate Analysis: Helps you analyze how fast a company is growing. • Dividend Information: Provides data on dividends paid by the stocks. • Smarter Decisions: Aids in making better informed investment choices.
- Category
- Data analysis tools
- Available on
- web
- Launched
- May 11, 2026
Reviews
No reviews yet. Be the first to share a useful, honest impression.
Sign in to review this app.
Opt in to release updates in your Rocket inbox. Unfollow here or in Notifications to stop future updates.